Browse abandonment occurs when visitors leave an ecommerce site after viewing product or category pages without adding anything to cart.
It is one of the clearest indicators of friction during product discovery, where interest fails to convert into intent.
With ecommerce conversion rates averaging just 2 to 3%, the biggest opportunity is not at the bottom of the funnel. It is in how effectively you guide shoppers from browsing to action.
This guide focuses on how to diagnose and reduce abandonment pre-cart. It explains where users drop off, what those exits actually signal, and how to turn high-intent browsing into measurable conversion lift.
TL;DR
- Browse abandonment = users view products but don’t add to cart
- Typically represents the largest share of drop-off in the ecommerce funnel
- Most losses happen during product discovery, not checkout
- Exit points (landing, category, product) signal different issues
- Bounce rate, exit rate, and abandonment rate must be read together
- High-intent abandoners are the most valuable segment to recover
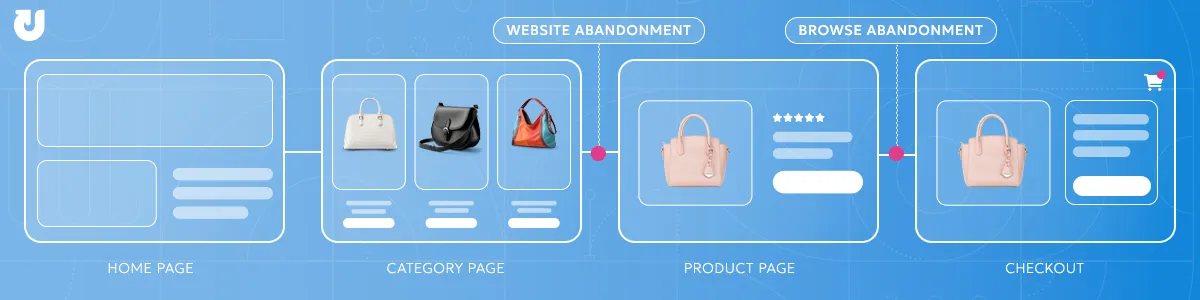
Browse Abandonment and Website Abandonment Explained
Website abandonment, also referred to as site abandonment, is the broader term for any exit before progressing toward a meaningful conversion action, such as adding to cart or entering checkout.
Browse abandonment is a specific subset, covering users who viewed product or category pages but left before adding anything to cart.
What makes browse abandonment distinct is that these users showed enough interest to explore. That makes their exit a more actionable signal than a homepage bounce or landing page exit, and a clearer indicator of where the product discovery experience is breaking down.
Not all browse abandonment carries the same weight.
Low-intent users who leave quickly are largely expected to do so. High-intent users who spend time exploring multiple products and then leave without acting signals fixable friction rather than low interest.
Because browse abandonment occurs earlier in the funnel than cart or checkout abandonment, it typically represents the largest share of total drop-off in the ecommerce journey.
Abandonment Is a Symptom, Not the Problem
Abandonment itself is not the issue. It is the signal.
A high exit rate or abandonment rate reflects underlying friction in the experience, whether that is unclear navigation, missing product information, weak trust signals, or mismatched expectations.
Reducing abandonment is not about lowering a metric in isolation. It is about identifying and resolving the root causes that prevent users from progressing.
The same abandonment rate can be driven by entirely different problems depending on where and how users exit.
Types of Abandonment Across the Funnel
Understanding where in the funnel drop-off is occurring is what determines where to focus optimization efforts.
Site abandonment covers exits before meaningful engagement begins, typically driven by low intent or a weak first impression on the landing page.
Browse abandonment covers exits after viewing products or categories but before adding to cart, reflecting friction in product discovery or evaluation. This is the largest and most consequential drop-off zone in the pre-cart funnel.
Cart abandonment covers exits after adding items but before checkout begins, reflecting hesitation during comparison or consideration.
Checkout abandonment covers exits during the checkout process itself, reflecting friction or trust issues at the point of conversion.
This guide focuses on site and browse abandonment, the pre-cart journey from landing page through product page. For a deep dive into what happens after a user adds to cart, see our Cart and Checkout Abandonment guide.
Where and Why Visitors Drop Off
Website and browse abandonment happen across multiple points in the customer journey, and where users exit reveals which part of the experience is underperforming.
Each exit point has a distinct set of causes. Understanding both together is what makes the diagnosis actionable.
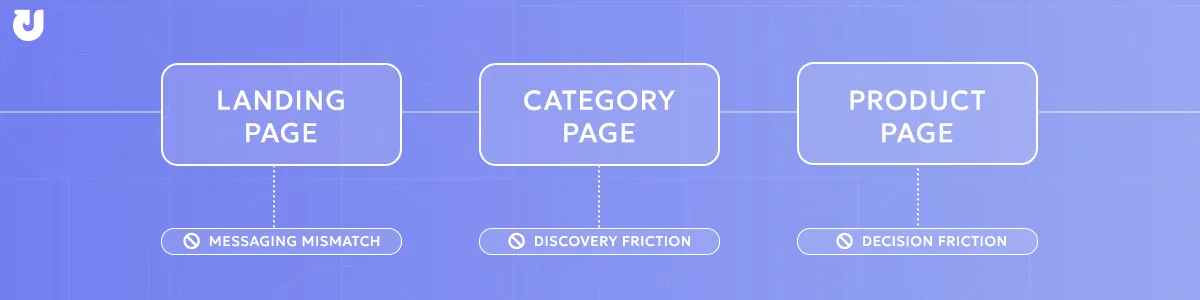
Landing Page Exits — Website Abandonment
When users exit a site immediately after landing, the issue is typically rooted in targeting or messaging rather than the on-site experience itself.
If the page does not match what the ad, email, or search result promised, no amount of on-site optimization will meaningfully reduce the exit rate.
A promotional email that drives to a sold-out product, or SEO content that attracts informational intent to a transactional page, will produce high exit rates regardless of how well the site is designed.
These exits are recorded as bounces rather than browse abandonment, but they represent the earliest opportunity to lose a visitor before product discovery even begins.
Only once messaging and landing pages are aligned can gaps in homepage conversion optimization be clearly identified and addressed.
Category Page Exits — Core Browse Abandonment
Category pages are where users arrive with intent to find something, but not yet sure what.
When users leave without clicking into a product, it typically means the page did not help them narrow their options effectively.
Common causes include limited filtering, unclear navigation, overwhelming product selection, unclear category structure, or slow load times that reduce patience before engagement occurs.
Because category pages sit between acquisition and evaluation, friction here compresses the entire funnel. Users who cannot quickly identify a relevant product rarely continue to product pages.
Mobile users are especially sensitive at this stage due to smaller screens and added navigation friction.
Product Page Exits — High-Intent Browse Abandonment
Product page exits are the highest-intent drop-off in the funnel.
A user reaching this stage has already moved through landing and category pages and is actively evaluating a specific product.
When they leave without acting, it typically signals a gap between expectations and the information needed to make a decision.
Common issues include unclear or misaligned pricing, insufficient product details, weak imagery, missing size or specification information, or lack of trust signals such as reviews.
Trust is a key factor here, with over 80% of consumers saying it influences their purchasing decisions.
At this stage, even small points of friction can prevent conversion because intent is already high.
How to Measure Browse and Website Abandonment
Measuring abandonment effectively requires looking beyond a single metric. The most useful approach combines abandonment rate, bounce rate, and exit rate, and segments them to reveal not just where users are leaving, but why.
Browse Abandonment Rate
The most direct measure of product discovery drop-off.
Formula: (Users who viewed product/category pages but did not add to cart) ÷ (Total users who viewed product/category pages) × 100
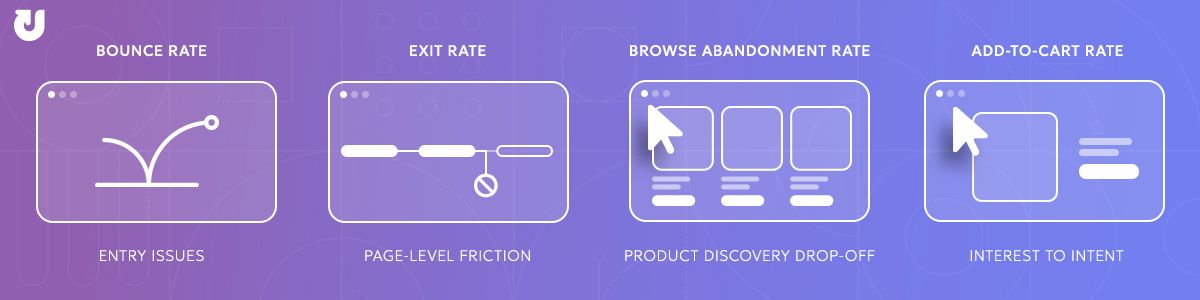
Bounce Rate
Bounce rate measures single-page exits. Most useful for diagnosing landing page and entry-point performance, and for identifying website abandonment driven by mismatched expectations before browsing even begins.
Bounce rate is a landing page diagnostic, not a browse abandonment metric.
Exit Rate
Exit rate measures where users leave within a session, regardless of how many pages they visited.
Most useful for identifying specific pages where users consistently drop off.
A category page with a high exit rate points to discovery friction. A product page with a high exit rate points to evaluation friction.
Add-to-Cart Rate
Add-to-cart rate is a critical conversion bridge metric that sits between browse and purchase intent.
A declining add-to-cart rate is often the first signal of worsening browse abandonment before other metrics catch up.
How These Metrics Relate
These metrics tell a layered story. Bounce rate reveals entry-point problems, exit rate identifies friction within the experience, and abandonment rate shows where forward momentum breaks down. No single metric is sufficient on its own.
Segmenting for Deeper Insight
Raw metrics become significantly more useful when segmented by:
- Page type: Landing pages, category pages, and product pages have different expected performance ranges and different root causes of drop-off
- Device type: Mobile users consistently abandon at higher rates, often for different reasons than desktop users
- Traffic source: Paid, organic, direct, and email traffic carry different intent levels and behave differently on site
- New vs. returning visitors: A returning visitor who abandons is a meaningfully different signal than a first-time visitor who bounces
Not all abandonment is worth optimizing for equally.
Low-intent users who exit quickly represent drop-off that is largely unavoidable.
High-intent users who view multiple products, spend meaningful time on site, and still leave without acting are the segment that matters most.
Their abandonment reflects conversion-ready traffic lost to friction, not lack of interest.
Segmenting by behavioral signals like session depth, pages viewed, and return visit status is what separates noise from actionable insight.
What Is a Normal Browse Abandonment Rate?
There is no universal benchmark for browse abandonment. Performance varies significantly based on category complexity, price points, traffic source mix, and device behavior.
However, industry benchmark data from Contentsquare shows that roughly half of all users leave after viewing just one page, with ecommerce bounce rates averaging around 47% and trending higher on mobile.
As a result, product and category page exit rates frequently fall in the 40% to 70% range, especially during early-stage browsing.
The goal is not to hit a universal number, but to outperform your own segmented baselines over time.
Instead of optimizing for a specific, fixed metric, a more effective strategy is to track your historical performance across different segments (device, traffic source, and page type).
By segmenting this data, you can track directional improvements over time and benchmark against your own past results.
How to Reduce Browse Abandonment
Reducing browse abandonment is not about eliminating exits. It is about removing the specific points of friction that prevent high-intent users from progressing.
The most effective strategies align directly to where users drop off in the browsing journey.
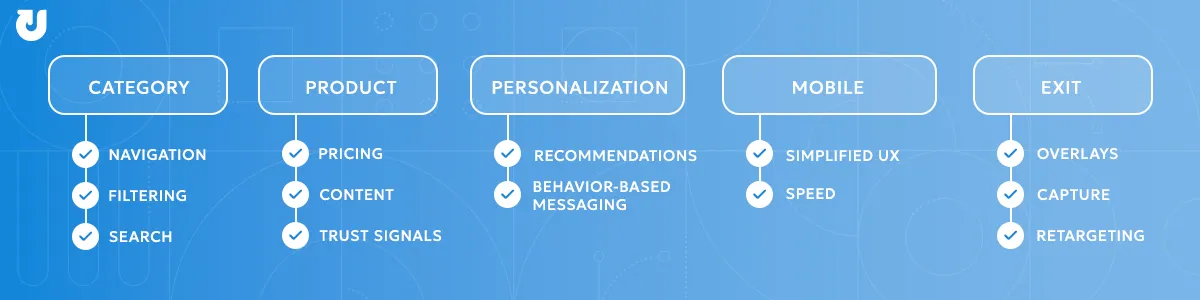
Improve Product Discovery on Category Pages
When users leave without clicking into a product, the issue is rarely lack of interest. It is an inability to find relevance quickly.
Focus on:
- Clear category structure and intuitive navigation
- Robust filtering and sorting options
- Fast load times, especially on mobile
- Prioritizing best-selling or high-relevance products
- On-site search quality.
Users who cannot find what they need through search often abandon rather than browse manually. Autocomplete, typo tolerance, and synonym matching are high-impact improvements that are easy to overlook.
Category page optimization starts with helping users find relevance quickly. If they cannot identify a viable option within seconds, they will not continue browsing.
Strengthen Product Page Decision-Making
Product page exits happen when users lack the information or confidence needed to act.
Focus on:
- Clear, transparent pricing and promotions
- High-quality imagery and detailed product descriptions
- Size guides, specifications, and FAQs
- Reviews and trust signals
- CTA placement and clarity. A button that is hard to find, generically labeled, or buried below the fold adds friction at the exact moment intent is highest. Test placement, contrast, and copy.
- Comparison support. Comparison shopping is one of the most common reasons users leave a product page. Giving them a side-by-side comparison tool or a 'frequently bought with' module reduces the need to leave the page to research alternatives.
Effective product page optimization strategies, focus on reducing uncertainty at each of these decision points.
At this stage, small gaps create hesitation that leads directly to abandonment.
Use Real-Time Behavioral Personalization
Not all users need the same experience. High-intent users benefit from guidance that reduces decision friction.
This includes:
- Personalized product recommendations
- Recently viewed items
- Messaging tied to user behavior (inventory levels, urgency, incentives)
- Segment-aware entry experiences. Returning visitors who previously browsed a category can be greeted with continuity, surfacing where they left off rather than restarting discovery from scratch.
Implementing effective behavioral personalization strategies helps ensure these experiences are structured around user intent and session behavior.
Personalization helps users move from exploration to decision faster.
Read our Behavioral Personalization guide for more information on personalizing the on-site experience.
Optimize for Mobile Browsing Behavior
Mobile users abandon more frequently due to friction, not lower intent.
Focus on:
- Simplified navigation and filtering
- Sticky CTAs and persistent cart visibility
- Faster load speeds and streamlined layouts
- Mobile design best practices like progressive disclosure reduce cognitive overload on smaller screens. Collapsible sections, tabbed product details, and expandable filters let users pull information when they want it rather than wading through everything upfront.
Mobile conversion rate optimization is one of the highest-impact levers for reducing abandonment at scale
Address Exit Intent Before Users Leave
Even with a strong on-site experience, some users will still leave. Capturing that moment is critical.
Effective tactics include:
- Exit-intent overlays with relevant offers or reminders
- Email capture tied to product interest
- Retargeting based on browse behavior
Timing and relevance matter more than incentive size. An overlay triggered after genuine browsing behavior with a contextually relevant message outperforms a generic discount shown to every visitor.
Segment your exit triggers by pages viewed, time on site, and return visit status.
The goal is not just to prevent abandonment, but to recover high-intent users who would otherwise be lost.
Website Abandonment Solutions That Drove Real Results
Understanding where and why users abandon is the diagnosis. The examples below show what addressing specific friction actually looks like in practice, spanning landing page exits, category drop-off, and product page hesitation, and what it produces when the right solution meets the right drop-off point.
Low Inventory Messaging Reduces Product Page Exits
Product page exits often happen when shoppers feel no immediate reason to act.
In a controlled test, when shoppers viewed a product with limited availability, low inventory messaging dynamically displayed remaining stock levels and updated in real time as inventory decreased.
This directly addressed the hesitation that drives product page drop-off by reinforcing demand and creating a reason to act before leaving.
Result: 18% conversion rate, $183,000 in recovered revenue over three months.

Personalized Recommendations Reduce Browse Abandonment for Returning Visitors
Category page exits frequently occur when users cannot quickly find products relevant to their needs.
When high-value returning shoppers viewed unavailable products, personalized product recommendations recognized their status and surfaced relevant alternatives, reducing the friction that typically causes browse abandonment when a desired product is out of stock and no clear alternative is presented.
Result: 24% click rate, 15% lift in average order value.

Social Proof Messaging Addresses Trust Gaps on Product Pages
Trust gaps are a common driver of hesitation on product pages, often causing users to delay or abandon purchases when they lack validation from other shoppers.
Within the broader website experience case study, one example focused on enhancing product pages with real-time social proof messaging, such as showing how many shoppers had recently viewed or purchased an item.
These cues provide subtle, in-the-moment validation that helps reinforce confidence without interrupting the browsing experience.
Result: 32% conversion rate, 5% increase in overall conversions.

Transparent Pricing Reduces Abandonment Driven by Expectation Mismatch
Pricing uncertainty is a significant driver of product page exits.
While this is often influenced by broader pricing strategy, brands can still improve how savings and incentives are communicated to better align perceived value with actual offers.
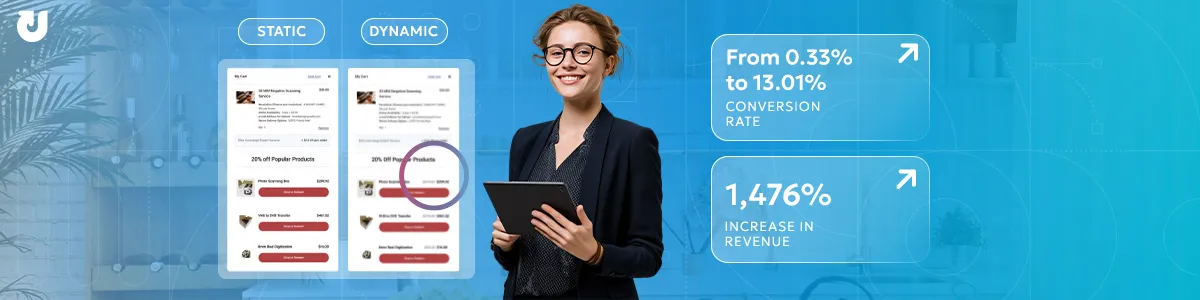
For example, a static experience might engage users abandoning a product or category page with relevant product recommendations alongside a blanket incentive or sitewide sale message. However, the savings themselves are not clearly personalized or calculated in real time.
A dynamic experience, by contrast, delivers the same product recommendations but applies incentives in real time, dynamically calculating and displaying either the updated total price or the total savings for each user.
Both approaches can be effective, but the key difference is clarity: users immediately understand what they would actually pay and what they save.
In dynamic vs static strategies, dynamic consistently outperforms static, making it a highly effective way to engage early-stage browsers and clearly communicate how site-level value translates directly to them.
Result: Conversion rate increased from 0.33% to 13.01%, with a 1,476% increase in revenue.
Trends Shaping Browse Abandonment
User expectations and browsing behavior continue to shift, and the bar for what constitutes a smooth ecommerce experience is rising.
Each of these trends raises the stakes for teams that have not yet addressed the core friction points covered in this guide.
![]()
Rising Expectations for Personalization
Personalization is becoming a baseline expectation.
According to McKinsey research, 71% of consumers expect personalized interactions and 76% report frustration when they do not receive them.
Increasingly, what looks like browse abandonment is actually a personalization failure, when users are not shown relevant products early enough in their journey.
Search-First Shopping Behavior
Many users bypass category navigation entirely if on-site search is weak. Poor search experiences often trigger immediate abandonment.
Research from the Baymard Institute consistently identifies navigation and filtering usability as a leading cause of browse-stage drop-off across the majority of ecommerce sites.
For teams seeing high category page exit rates, on-site search performance is worth examining alongside navigation structure.
Faster Judgment Cycles
Users form opinions about a site's quality in milliseconds.
Factors like slow load times, visual clutter, or a confusing information hierarchy lead to immediate abandonment, as users rarely give a site a second chance.
With faster judgment cycles, issues that were once minor inconveniences now actively drive users away.
According to Google research, a page load time increase from one to three seconds is associated with a 32% jump in the probability of a bounce.
Why Mobile Drives Higher Abandonment
Mobile users abandon at higher rates than desktop users, driven by smaller screens, slower connections, and more frequent real-world interruptions.
As mobile continues to grow as a share of ecommerce traffic, its contribution to overall browse abandonment becomes increasingly hard to ignore.
Mobile-specific exit rate data is one of the clearest signals of where UX friction is concentrated.
What Happens After You Identify Abandonment
Diagnosing browse and website abandonment is the foundation, but understanding where users drop off and why is only the starting point.
The next step is addressing those patterns through both on-site improvements and targeted re-engagement.
On-site, that means resolving the foundational friction points covered in this guide: navigation clarity, pricing transparency, trust signals, and product page content.
Behavioral personalization takes it further, using real-time signals to tailor the browsing experience to individual users before they have a reason to leave.
Off-site, it means reaching users after they abandon through email and paid media, bringing them back at the right moment with messaging tied to what they actually browsed.
For users who make it past browse and into cart or checkout before dropping off, the strategies shift significantly. The Cart and Checkout Abandonment guide covers re-engagement tactics specific to those later funnel stages.
Additional Ecommerce Abandonment Resources
If you want to explore website and browse abandonment strategies in more detail, the resources below expand on the ideas covered in this guide.
- Conversion Optimization: Optimizing Your Homepage
- Conversion Optimization: 7 Tips to Optimize Category Pages
- Conversion Optimization: 4 Ways To Optimize Your Product Pages
- Understanding Bounce Rates and How to Improve Yours
- 7 Strategies to Convert Comparison Shopping Consumers
- Real-Time Behavioral Personalization Guide
- 5 Design Best Practices for Mobile-Friendly Conversion Strategies
- Mobile vs. Desktop CRO: How to Maximize Mobile Campaign Performance
- 4 Ways to Capture Leads Without Offering an Incentive
- Low Inventory Case Study
- AI Recommendations Case Study
- Website Experience Case Study
- Static vs Dynamic Engagements Case Study
Frequently Asked Questions About Website & Browse Abandonment
What Is Browse Abandonment?
Browse abandonment occurs when visitors view product or category pages on an ecommerce site but leave without adding anything to cart. It is a subset of website abandonment and the largest drop-off point in the ecommerce funnel.
How Is Browse Abandonment Different from Website Abandonment?
Website abandonment is the broader term covering any exit before a meaningful conversion action is completed.
Browse abandonment is a specific subset that occurs when users have engaged with product or category pages but leave before adding anything to cart.
Why Is Browse Abandonment So High?
Browse abandonment is inherently high because many users visit with exploratory rather than purchase intent.
However, unusually high rates can also indicate friction in navigation, product pages, or site experience that is causing higher-intent users to leave. Those two causes require very different responses.
What Is a Good Browse Abandonment Rate?
There is no universal benchmark. The goal is not to eliminate abandonment but to reduce friction so that more users with genuine interest progress toward add-to-cart. Trend improvement, segmented by device and traffic source, is more useful than a fixed target.
What Causes Product Page Exits?
Most commonly: unclear product information, confusing or missing pricing, weak trust signals, slow load times, or insufficient imagery.
These gaps create hesitation at the moment a user is actively evaluating a specific item. Intent is highest at this stage, and the cost of friction is greatest.
What Causes Category Page Exits?
Poor navigation, overwhelming product selection, unclear category hierarchy, or ineffective filtering.
When users cannot quickly find products relevant to their needs, they leave rather than searching further.
On-site search quality is also a factor. Users who cannot find what they want via search often abandon rather than browse manually.
How Does Mobile Impact Browse Abandonment?
Mobile users abandon at higher rates due to smaller screens, slower load times, and more frequent distractions.
As mobile traffic grows, its share of overall browse and website abandonment grows with it.
This makes mobile-specific segmentation one of the most important lenses for identifying where friction is concentrated.
How Is Browse Abandonment Different from Bounce Rate?
Bounce rate measures single-page exits.
Browse abandonment captures users who explored multiple pages but left before adding to cart.
Both reflect exit behavior but point to different problems. Bounce rate is an entry-point diagnostic, while browse abandonment is a product discovery diagnostic.
Why Is Browse Abandonment Important for Ecommerce?
Browse abandonment represents the largest drop-off point in the funnel.
Because it affects the highest volume of engaged traffic, even modest improvements in early-stage engagement have a meaningful impact on overall conversion rates and revenue.